Livingston County ranks among the highest three Michigan counties in median home value, at $347,800.
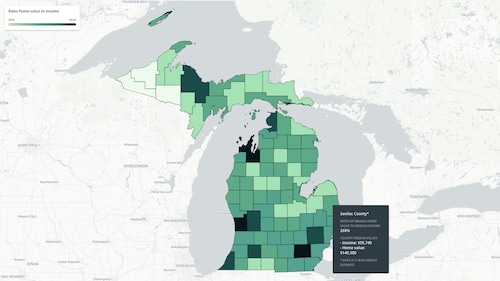
But the county is also has the highest median income in Michigan, at $102,508. So the median home is worth 3.4 times more than the median income.
That gap isn’t as bad as a handful of other counties in Michigan, where the discrepancy between housing prices and incomes is wider. Leelanau County’s median home is 4.5 times higher than the median income. Washtenaw County isn’t far behind, at 4.3.
The higher the gap, the tougher it is to afford housing.
RELATED: Yes, housing really is more unaffordable in Kalamazoo — here’s why
Measuring the home value-to-income gap is just one way of understanding the housing affordability problem across Michigan. Here are five statistics that tell the story.
(NOTE: The 2023 Census survey data was limited to counties with at least 65,000 residents. That’s 30 of Michigan’s 83 counties, which is 85% of the state population. For the smaller counties, the data comes from the Census’ five-year rolling average for 2018-22, which was released last December.)
1. Michigan’s median home is 3.4 times the median household income.
Statewide, the median home is $236,100 — which is 3.4 times the median household income.
As a standard rule of thumb, people shouldn’t buy a house that is more than 2.5 times their annual household income.
The gap in Michigan has grown for the past decade, but grew particularly fast post-pandemic.
The state’s median household income is $69,183, which means an affordable house for that household would be about $173,000, using that metric.
Counties with the highest ratio of median household income to home values: Leelanau (median home value is 4.5 times median income), Washtenaw (4.3), Grand Traverse (4.1), Ottawa (4), Berrien (3.8), Kalamazoo (3.7) and Kent (3.7).
Here’s a look at the top 10 and bottom 10, plus an interactive map with data from every county.
2. 28% of Michigan households pay too much for housing
About 28% of all Michigan households are considered “cost-burdened” by housing costs. And for renters alone, the number was 51% in 2023 — up from 48% in 2019.
Households are considered “cost-burdened” when they spend more than 30% of their pre-tax income on rent or mortgage payments plus other housing costs like utilities, property taxes and insurance, according to the U.S. Department of Housing and Urban Development.
There’s a big divide between renters and homeowners when it comes to the burden of housing costs.
While 51% of Michigan renters are cost-burdened, only 24% of homeowners with a mortgage and 16% of those without a mortgage are cost-burdened.
One reason for the divide: Michigan homeowners have a median income of $82,155 while the 2023 median income for renters is $54,368.
The real median gross cost of renting in the United States increased 3.8% in 2023, which was the largest annual increase since at least 2011, based on the Census data. In Michigan, the one-year increase was even higher, at 4.7%.
As a sidenote: college towns typically have a disproportionate number of residents spending more than 30% of their income on housing. That’s because off-campus students are included in the Census’ housing statistics, even if parents are paying the rent.
Thus, it is no coincidence that counties with the highest percentage of cost-burdened households include Washtenaw (home to University of Michigan and Eastern Michigan University), Ingham (Michigan State), Kalamazoo (Western Michigan) and Isabella (Central Michigan).
Wayne County has the highest rate, however, with 34% of residents spending at least 30% of their income on housing.
Here are the top 10 and bottom 10 counties.
The map below shows which counties have the most cost-burdened residents. Click a county to see separate details for homeowners and renters.
3. Michigan’s median gross monthly rent was $1,011 for 2023
That’s up from $888 in 2019, a 24% increase in five years. Gross rent includes utilities paid by the renter.
The five counties with the highest median rent in 2023 were:
- Washtenaw, which includes Ann Arbor: $1,451
- Grand Traverse, which includes Traverse City: $1,357
- Oakland: $1,349
- Kent, which includes Grand Rapids: $1,270
- Livingston, which includes Brighton and Howell: $1,231
Of the 30 counties in which one-year data was available, the counties with the lowest median rent were: Midland ($894), Marquette ($842), Ionia ($816), Bay ($811) and Van Buren ($758).
4. Michigan’s median home value for 2023 was $236,100
That’s up from $169,600 in 2019, a 39% increase.
About 74% of Michigan households have an owner-occupied residence. It was 72% in 2019.
The median housing cost for a homeowner with a mortgage was $1,509 in 2023, which includes utilities, property taxes, insurance and any homeowner association fees. That compares to $1,285 in median gross housing costs in 2019.
Homeowners without a mortgage had a median housing cost of $593 in 2023, compared to $487 in 2019.
The five counties with the highest median home value: Leelanau ($371,200), Washtenaw ($360,400), Livingston ($347,800), Grand Traverse ($343,200) and Oakland ($338,000).
5. The number of million-dollar homes in Michigan has doubled since 2019
Michigan had an estimated 50,890 owner-occupied homes in 2023 that were worth more than $1 million dollars, according to the latest Census data. That compares to 25,424 in 2019.
That means 1.7% of homes were worth $1 million or more in Michigan in 2023.
Leelanau and Grand Traverse has the biggest percentages — million-dollar homes comprise about 9.6% and 8.5% of their housing stock respectively, based on latest Census estimates.
In raw numbers, Oakland County has the largest number, an estimated 12,937 homes, which is a quarter of the million-dollar homes in the state.
For more MLive data stories, visit mlive.com/data.

